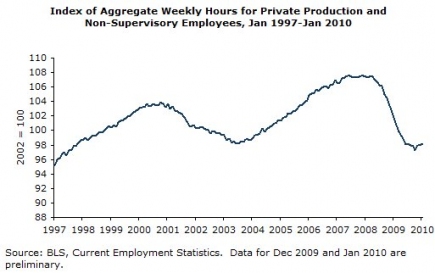
 The index of total hours worked is below the November 1997 level.
The unemployment rate fell to 9.7 percent in January, driven by a 0.4 percentage-point drop in the unemployment rate for women to 8.4 percent. The unemployment rate for men fell 0.2 percentage points to 10.8 percent. This drop came in spite of a reported loss of 20,000 jobs in the establishment survey.
The improved employment picture was primarily a story for adult white women. Their unemployment rate fell by 0.6 percentage points to 6.8 percent, while their employment rate (EPOP) rose by 0.6 percentage points to 56.1 percent. The unemployment rate for black women rose slightly to 13.3 percent, although their EPOP also rose 0.2 percentage points to 54.7 percent. It is striking that the EPOP for white women is now 1.4 percentage points higher than for black women. Until last summer it had always been lower, although the gap had been narrowing over the last three decades.
For blacks overall, January was a bad month. The unemployment rate rose to 16.5 percent, the highest of the downturn. The unemployment rate for black men rose a full percentage point to 17.6 percent, also a high for the downturn.
By education group, the big winners were people with some college, who saw 1.2 percentage-point increase in their EPOP. There was little change in the EPOPs for other groups. Workers over age 55 continued to fare best, accounting for 178,000 of the 541,000 increase in employment. Women over age 55 accounted for 140,000 of these jobs.
In addition to the gains in employment, the household survey also showed a sharp fall in the number of people involuntarily working part-time, from 9,055,000 to 8,193,000. The U-6 measure of labor market slack correspondingly fell from 17.3 percent to 16.5 percent. It is also worth noting that the percentage of the unemployed who have voluntarily quit their job has edged up to 6.1 percent. This is still very low, but somewhat better than the 5.6 percent reported last summer, suggesting somewhat greater confidence in the labor market.
The establishment data look somewhat less positive. Not only do the data continue to show job loss, but the job loss over the last three months (Oct-Dec) was revised upward by 102,000, giving an average job loss of 103,000 per month over this period. Without 33,000 temporary census jobs, the establishment survey would have shown a loss of 53,000 jobs for January.
However, even in the establishment survey there are some positive signs. Manufacturing employment increased by 11,000, the first gain since January of 2007. This was fully explained by a 22,700 rise in auto employment. While this may not be repeated, it is likely that manufacturing employment has finally bottomed out.
Retail trade added 42,100 jobs, although this may be a seasonal anomaly with fewer people than normal hired in the holiday season and therefore fewer layoffs in January. Employment services showed another big increase, adding 52,000 jobs in January. This is consistent with a picture of employees getting ready to add permanent employees. Hours worked also increased, with the index of aggregate hours rising from 97.9 to 98.2.

However, there were also many negative aspects to the establishment data. Construction lost another 75,000 jobs, the vast majority in non-residential construction. State and local governments shed 41,000 jobs. The leisure and hospitality sector shed 14,000 jobs. Even health care seems to be weakening as a bastion of employment growth, adding just 14,500 jobs in January.
The benchmark revisions show the downturn to be even deeper than previously believed. The revised data show a loss of 8,424,000 from the peak in December of 2007. Over the decade from January 2000 to January 2010, the economy actually lost 1,254,000 jobs. The economy lost 2,100,000 construction jobs (27.2 percent) since the peak in August of 2006 and 2,467,000 manufacturing jobs since the decline began in January 2007. The index of hours worked is below the November 1997 level.
On the whole, there is some positive news in this report, with the household survey showing a much brighter picture than the establishment survey. It is possible that the birth/death data could now be understating job growth.
*This article originally appeared in CEPR on February 5, 2009.
About the Author: Dean Baker is the Co-director of the Center for Economic and Policy Research. CEPR’s Jobs Byte is published each month upon release of the Bureau of Labor Statistics’ employment report. For more information or to subscribe by fax or email contact CEPR at 202-293-5380 ext. 102, or chinku [at] cepr [dot] net.

